
The Caban African Growth Capital Monitor
The quarterly benchmark on capital flowing into African businesses: five years of funding data, the equity–debt mix, market concentration, exits, and what it means for founders and investors — compiled by the Caban analyst desk from primary trackers and our own market position.
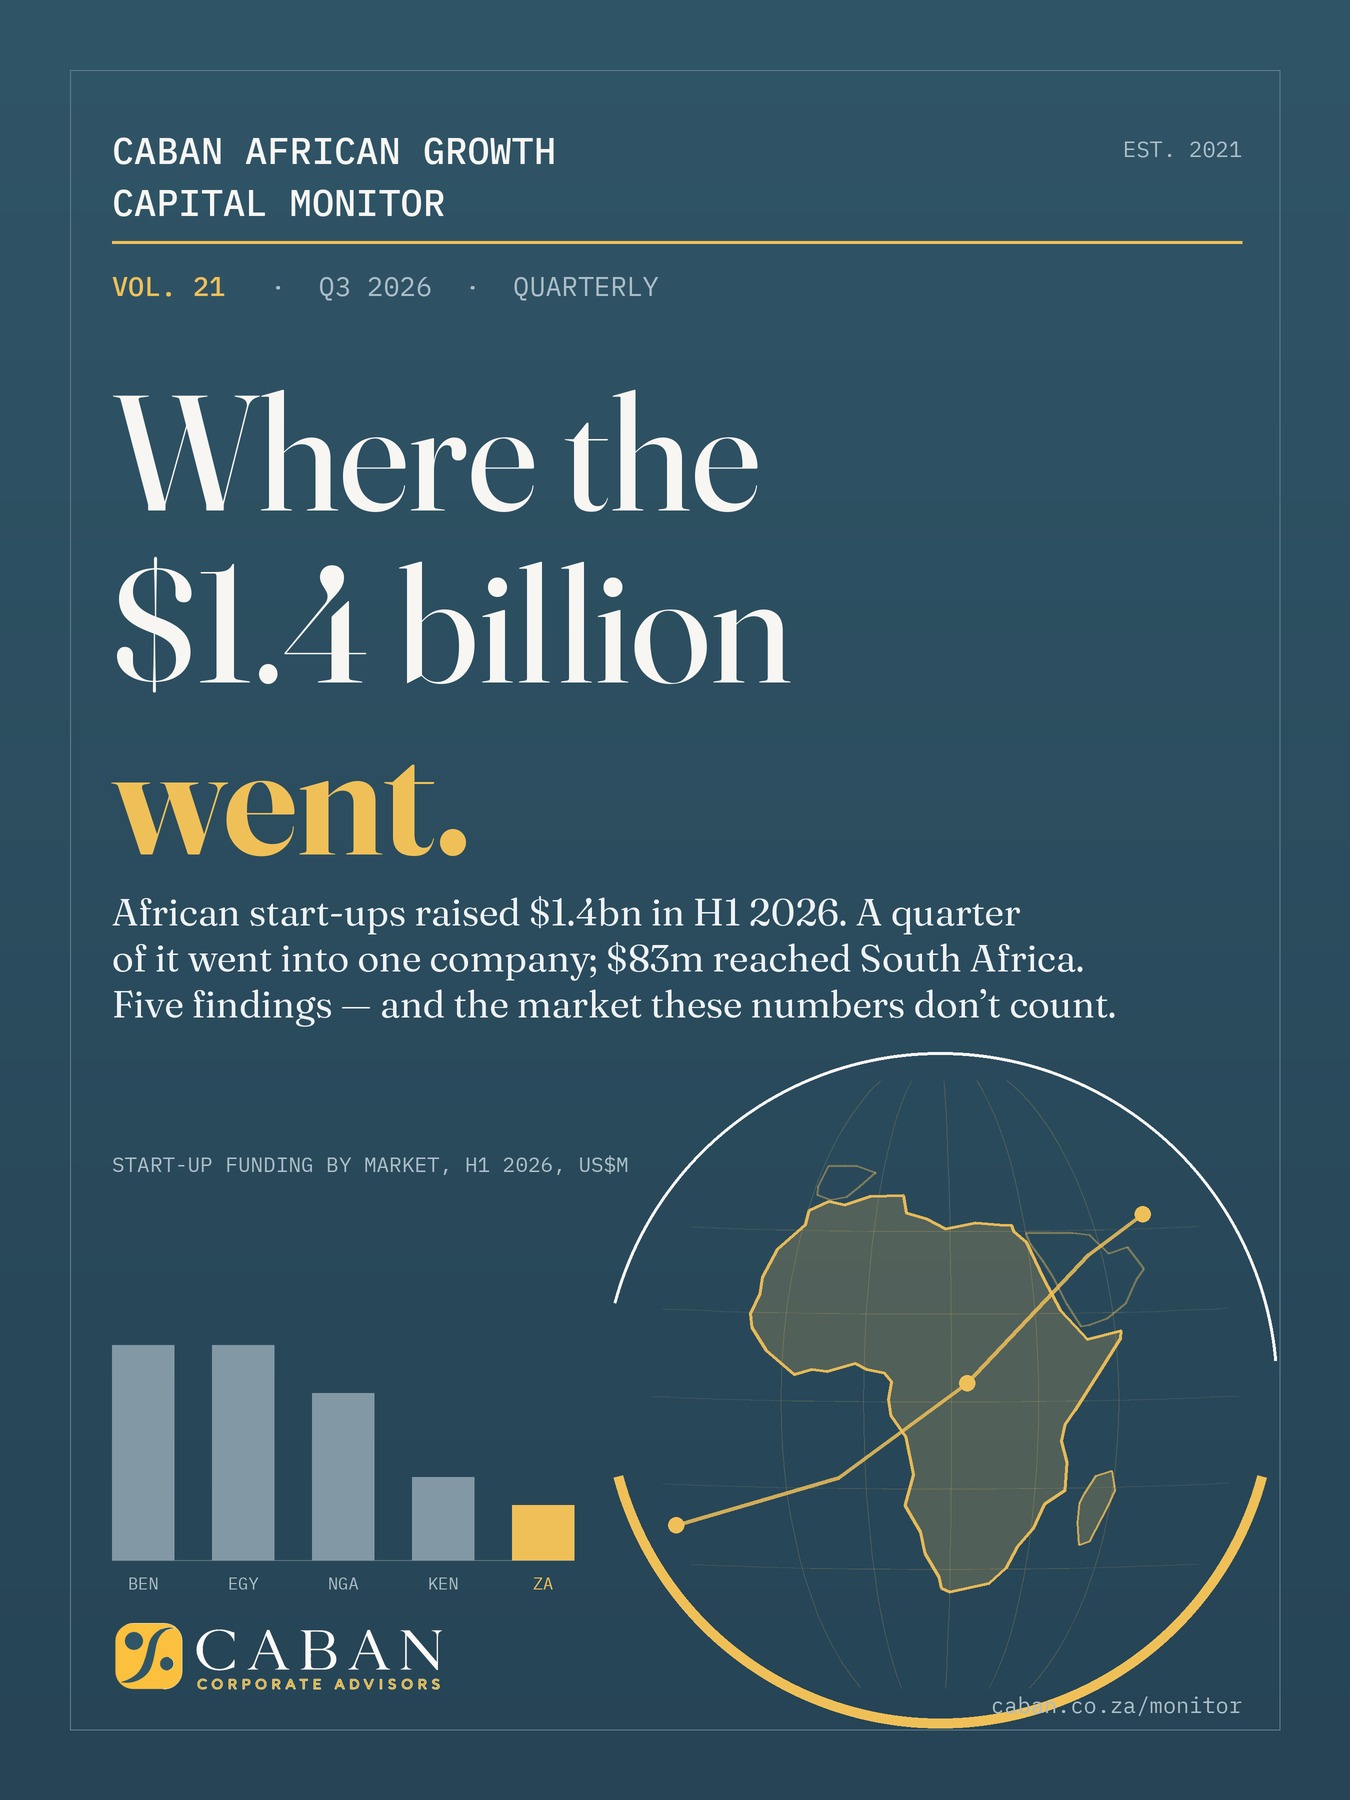
Read Vol. 21 — Q3 2026 edition (latest)
Free, in full, with every chart. Enter your details and you'll also receive each quarterly edition on release.
The archive: five years, twenty-one editions
Every quarter of African growth capital since Q3 2021 — the boom, the winter, the debt shift, and the recovery. Volumes 1–19 compiled as a retrospective series; quarterly publication live from Vol. 20.
What’s Behind the $3.2bn Rebound
Vol. 19 · Q1 2026A Cooler, Harder Market
Vol. 18 · Q4 2025The Window Reopens
Vol. 17 · Q3 2025Energy Takes the Lead
Vol. 16 · Q2 2025The Wobble
Vol. 15 · Q1 2025The Strongest Start Since 2022
Vol. 14 · Q4 2024The Winter’s Last Quarter
Vol. 13 · Q3 2024Instruments Over Announcements
Vol. 12 · Q2 2024Dry Powder Builds
Vol. 11 · Q1 2024Floor-Finding
Vol. 10 · Q4 2023The Year the Market Reset
Vol. 9 · Q3 2023The Driest Ground
Vol. 8 · Q2 2023Debt Steps Forward
Vol. 7 · Q1 2023Winter, Properly
Vol. 6 · Q4 2022A Record With an Asterisk
Vol. 5 · Q3 2022Gravity Arrives
Vol. 4 · Q2 2022The Turn Begins
Vol. 3 · Q1 2022Peak Momentum
Vol. 2 · Q4 2021A Record Year Closes
Vol. 1 · Q3 2021The Unicorn Quarter
Deploying into the market? Investing in South Africa: the allocator guide → · Local origination partner →
Beyond the research
Caban is an investor-advisor: we raise capital, run sale and acquisition mandates, and invest our own. If the data raises a question about your own business, ask a principal.
Talk to a principal