
African & South African start-up funding statistics
Continental funding
Total African start-up funding in H1 2026 across four trackers — a 24% spread driven by how debt is counted.
Source: Launch Base Africa · Big Deal · TechCabal · Condia, Jul 2026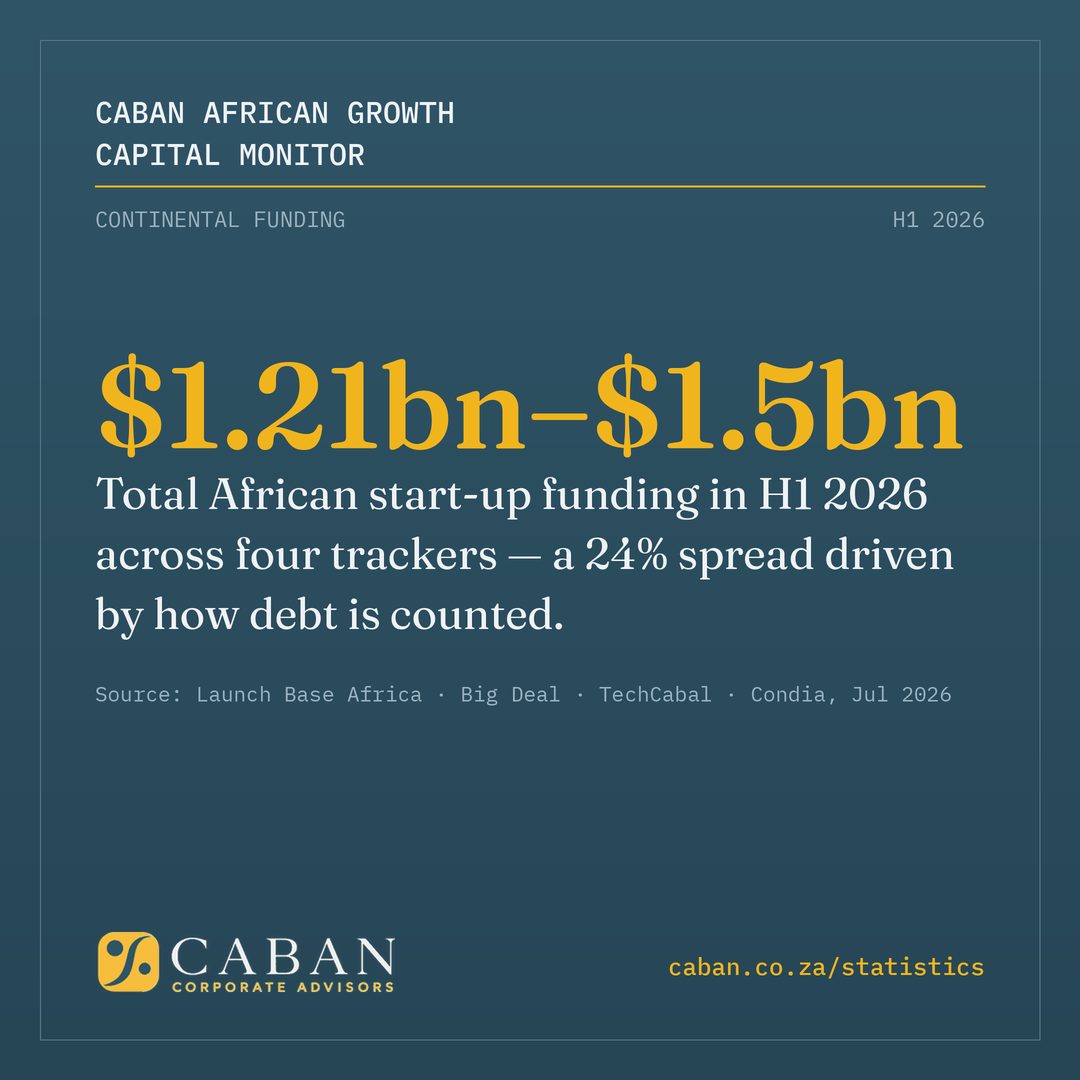
H1 2026 total funding versus H1 2025 on like-for-like tracking; equity −7%.
Source: Africa: The Big Deal, Jul 2026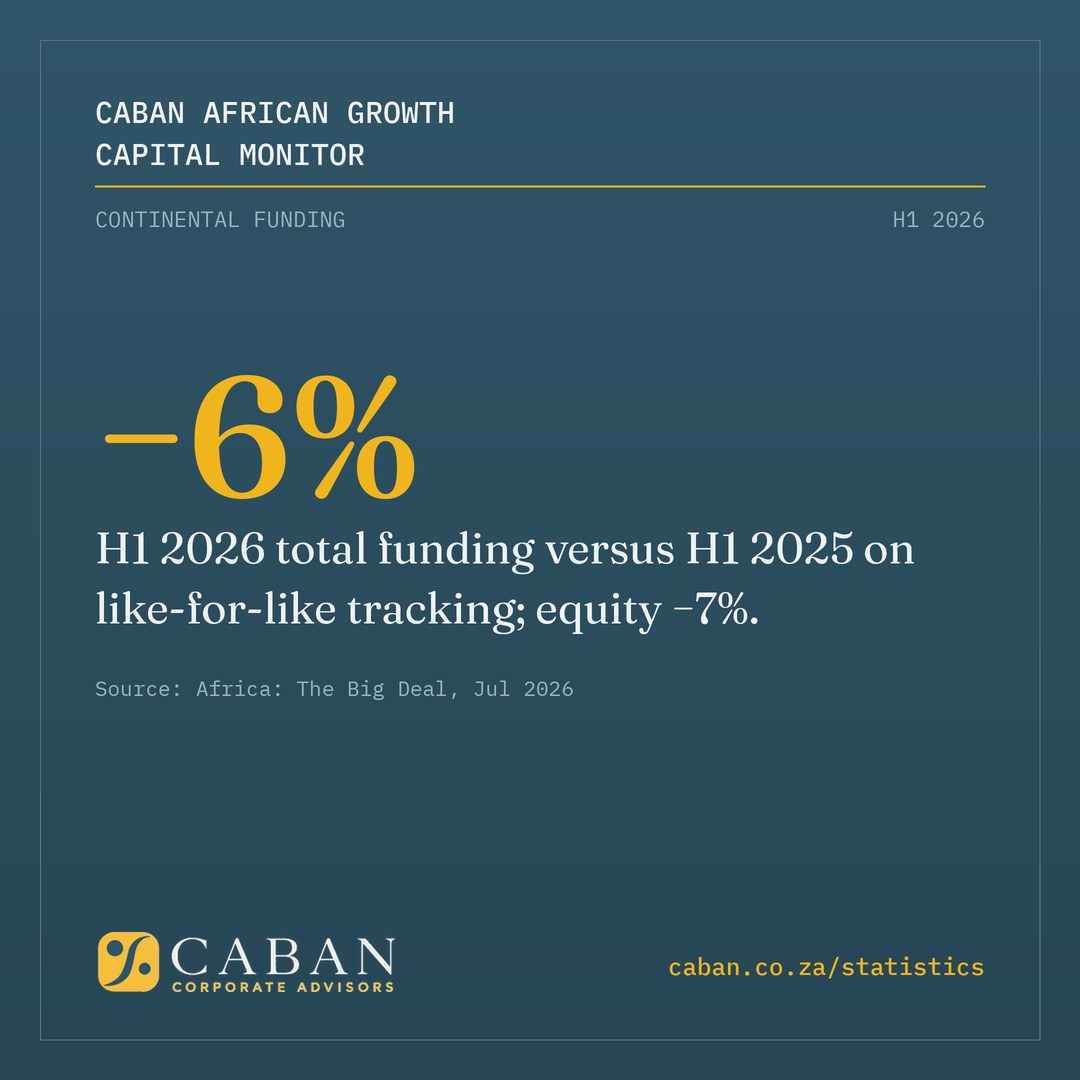
Raised in June 2026 alone — 91% equity, the strongest equity month since March 2022.
Source: Africa: The Big Deal, Jul 2026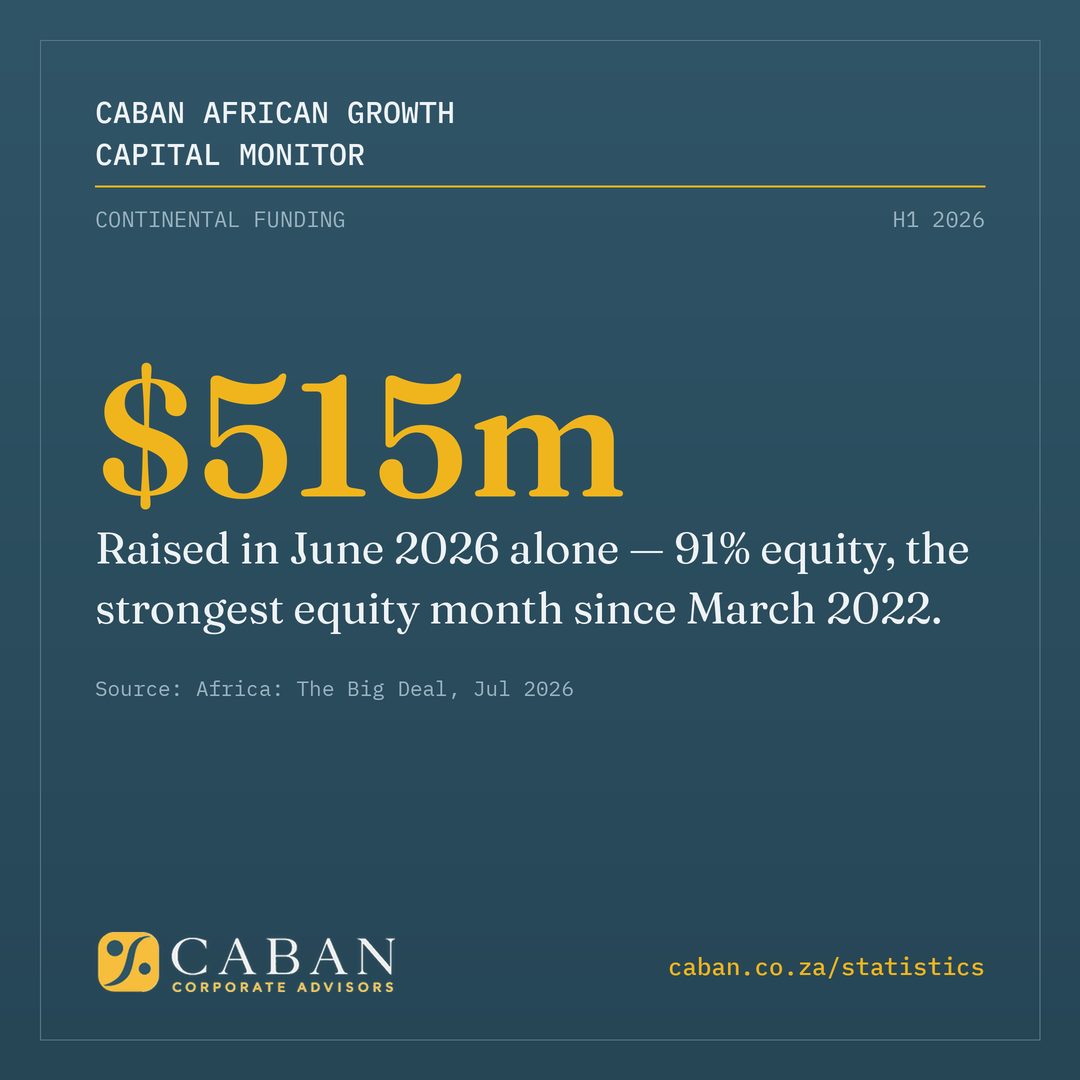
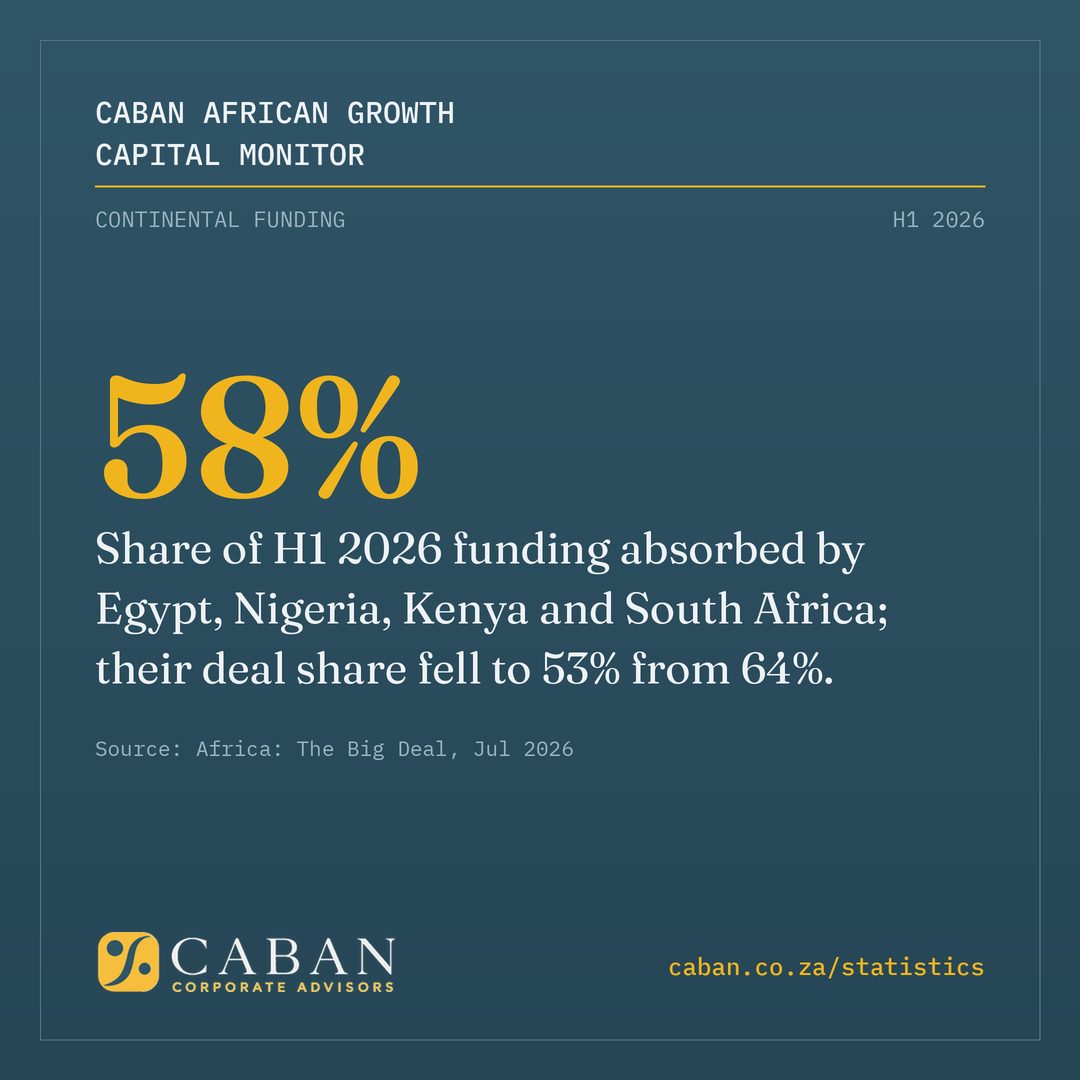
Country league table
Benin leads the H1 2026 country table — entirely on Spiro. Egypt $327m · Nigeria $254m · Kenya $126m · SA $83m.
Source: Africa: The Big Deal, Jul 2026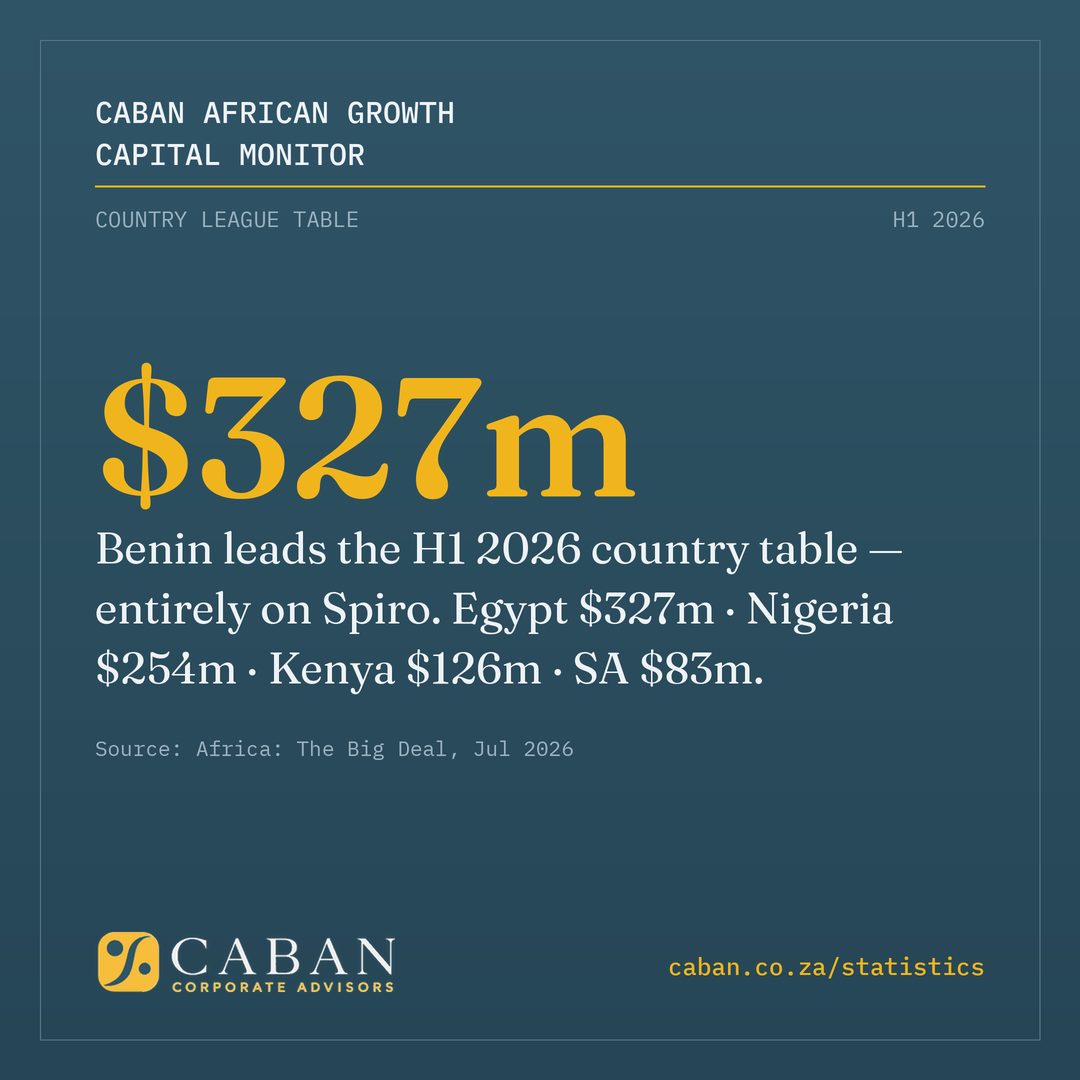
Raised by South African start-ups in H1 2026 — fifth on the continent. Venture tracking only.
Source: Africa: The Big Deal, Jul 2026
Share of all disclosed continental capital taken by one company: Spiro’s $327m across four rounds.
Source: Africa: The Big Deal · announcements, Jun 2026
Deal sizes & early stage
Fall in start-ups raising $100k–$1m: 179 in H2 2025 to 100 in H1 2026. Seed deal count down 60%.
Source: Big Deal · Launch Base Africa, Jul 2026
Median disclosed deal size in H1 2026 — nearly halved from $4.65m. Mean held near $12m on one outlier.
Source: Launch Base Africa, Jul 2026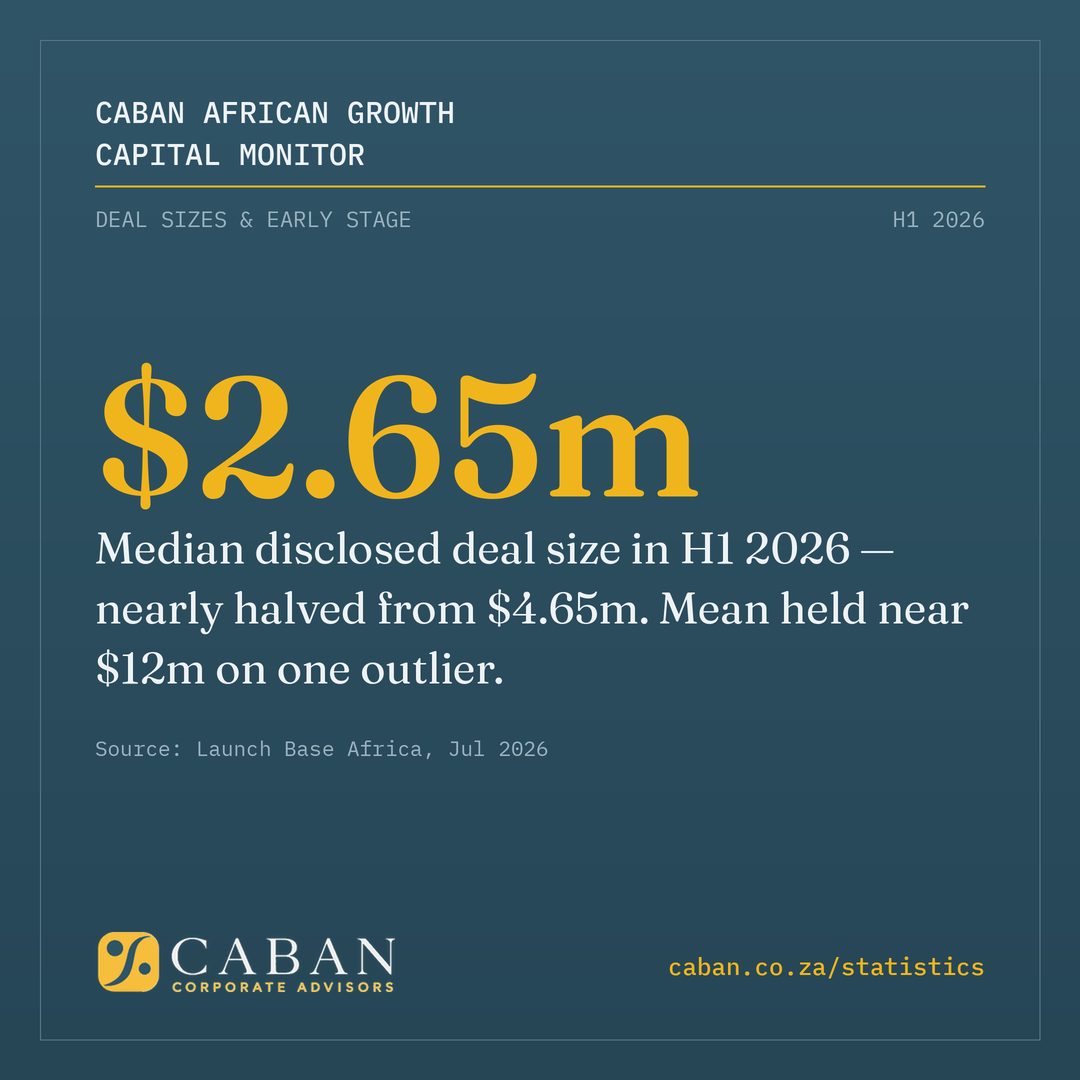
Median time from seed to Series A for African start-ups — up from 18 months two years earlier.
Source: Africa: The Big Deal, 2026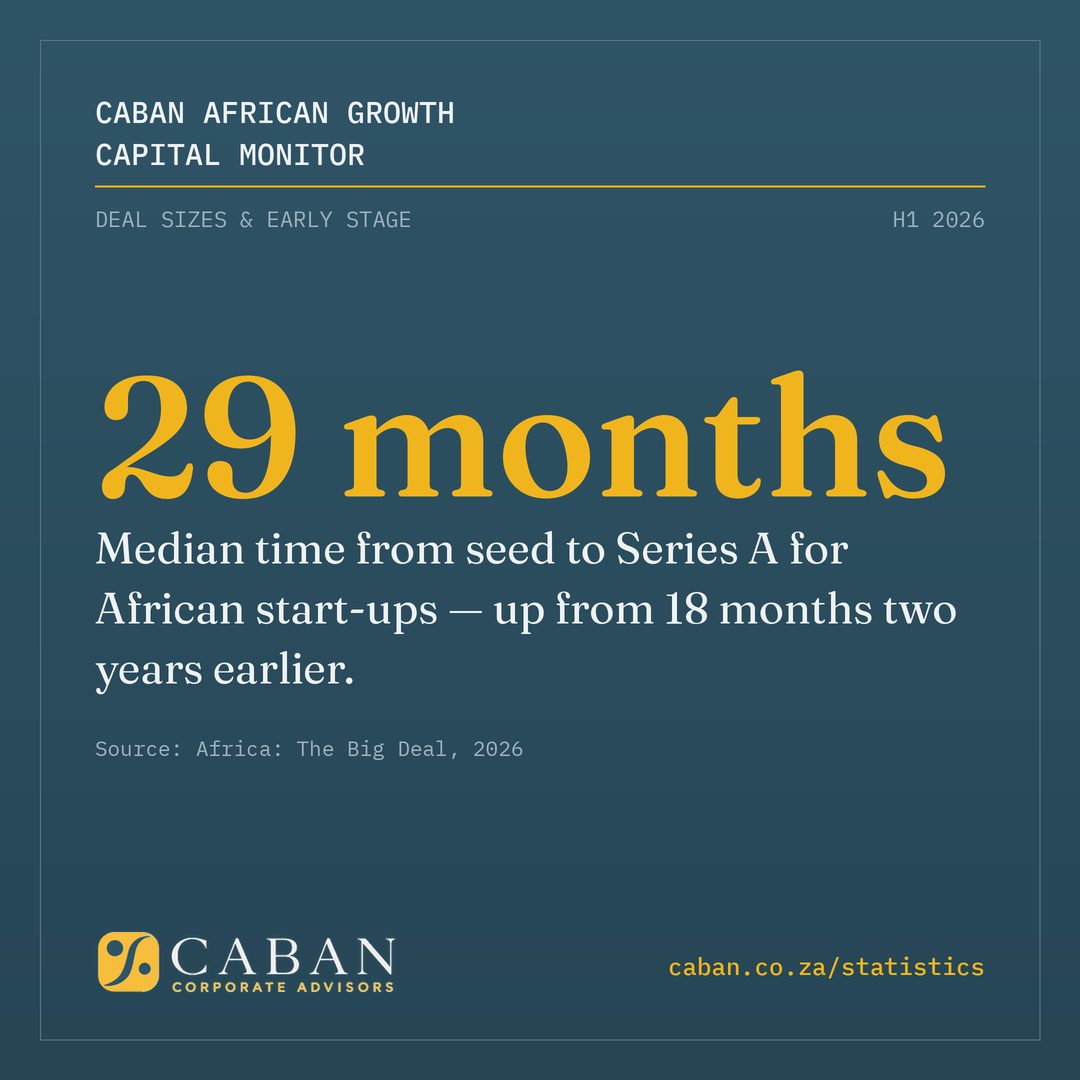
Share of Q1 2026 funding to women-led or women-co-founded companies — roughly half the prior year.
Source: Africa: The Big Deal, 2026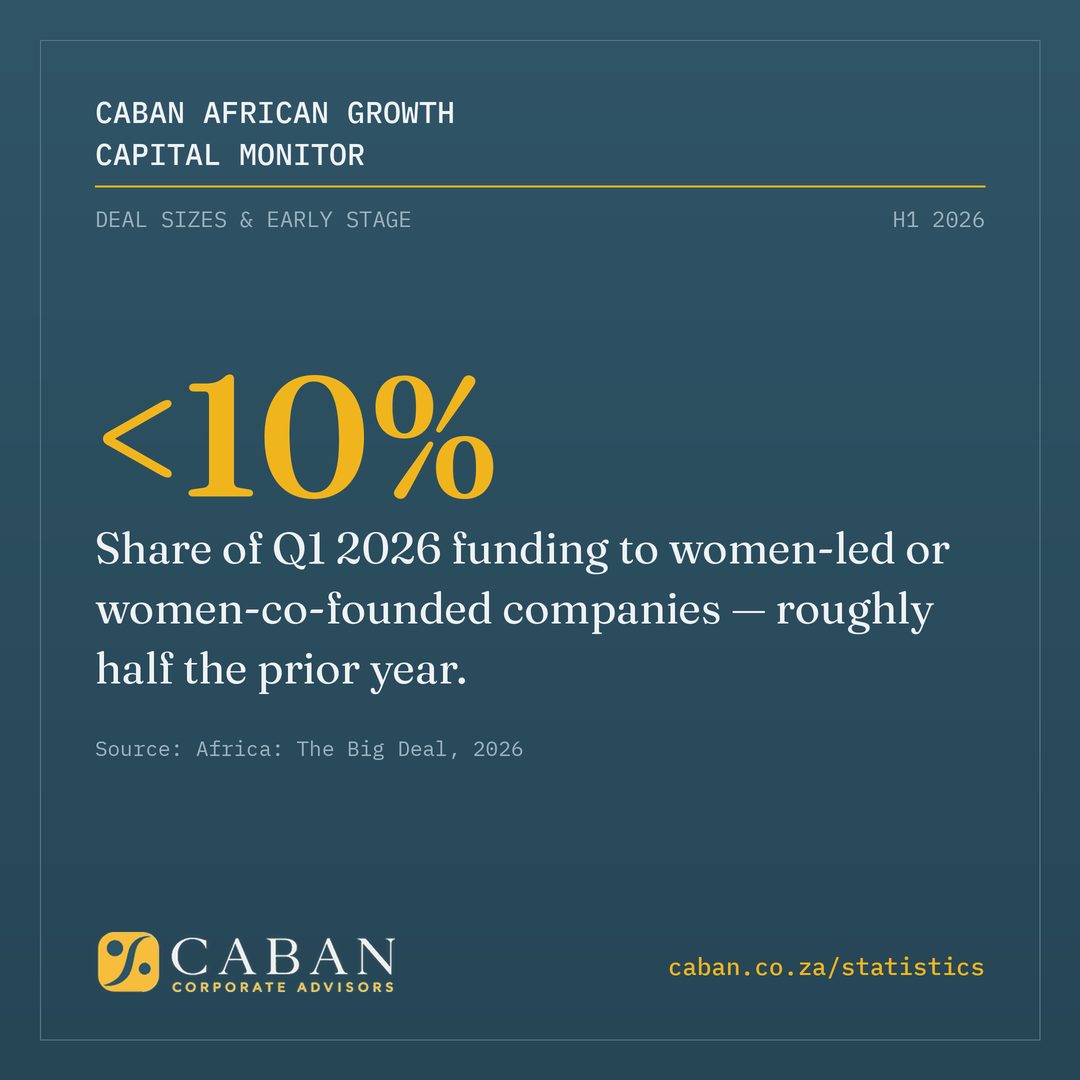
Debt vs equity
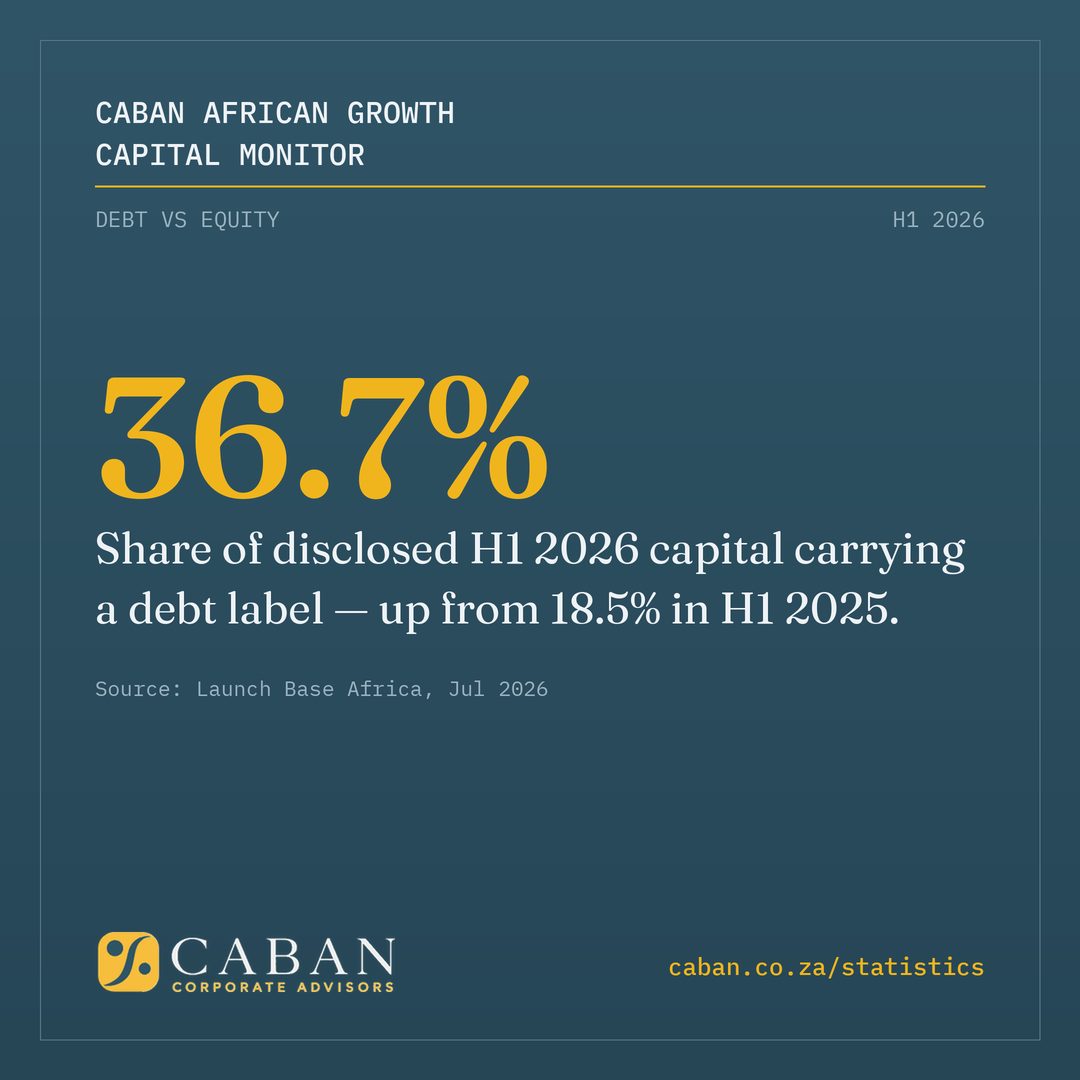
TechCabal’s H1 2026 split of equity versus debt. The largest debt deals were asset-backed.
Source: TechCabal Insights, Jul 2026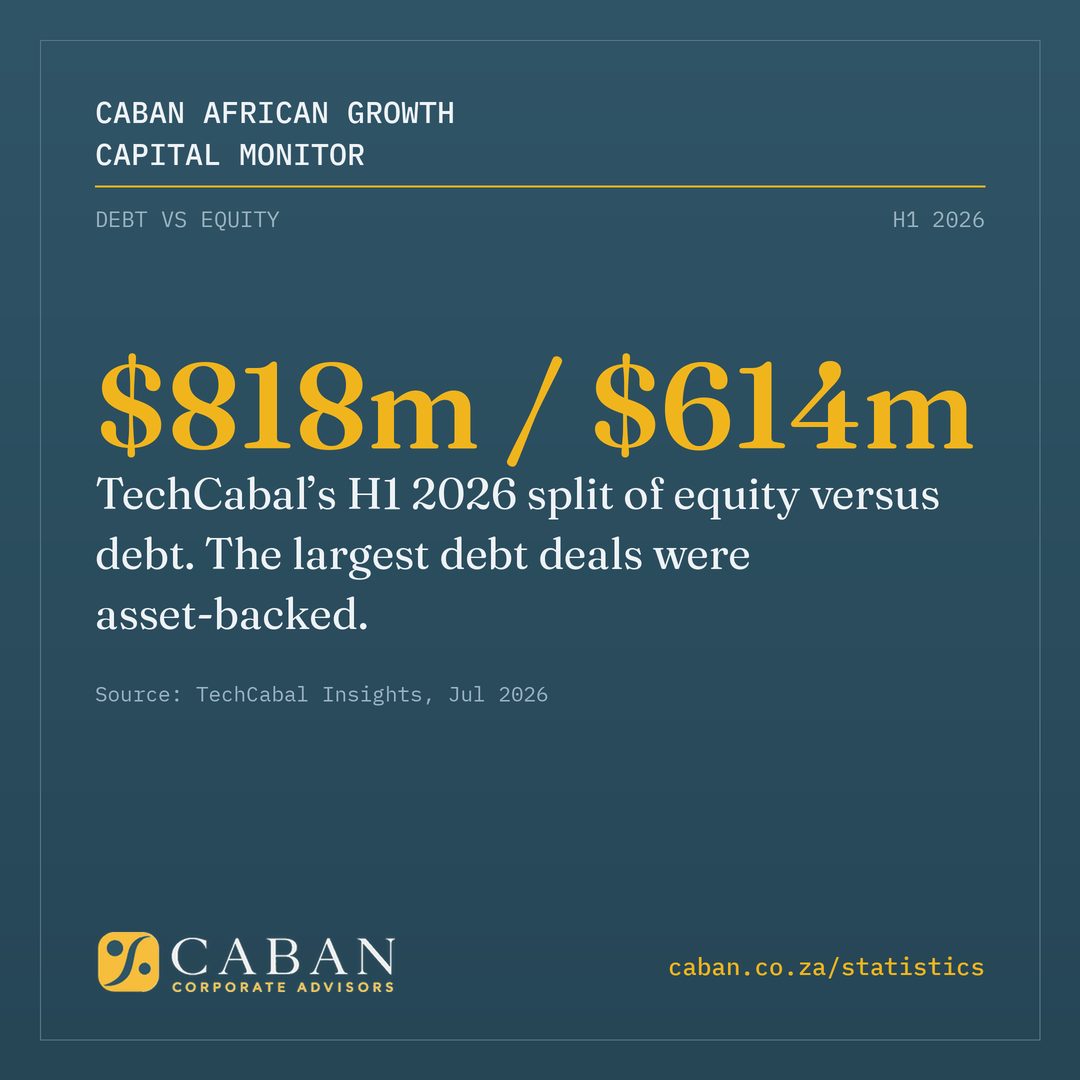
M&A and exits
African tech M&A transactions in H1 2026 — an all-time half-year record, against 33 in H1 2025.
Source: Caban Monitor compilation, Jul 2026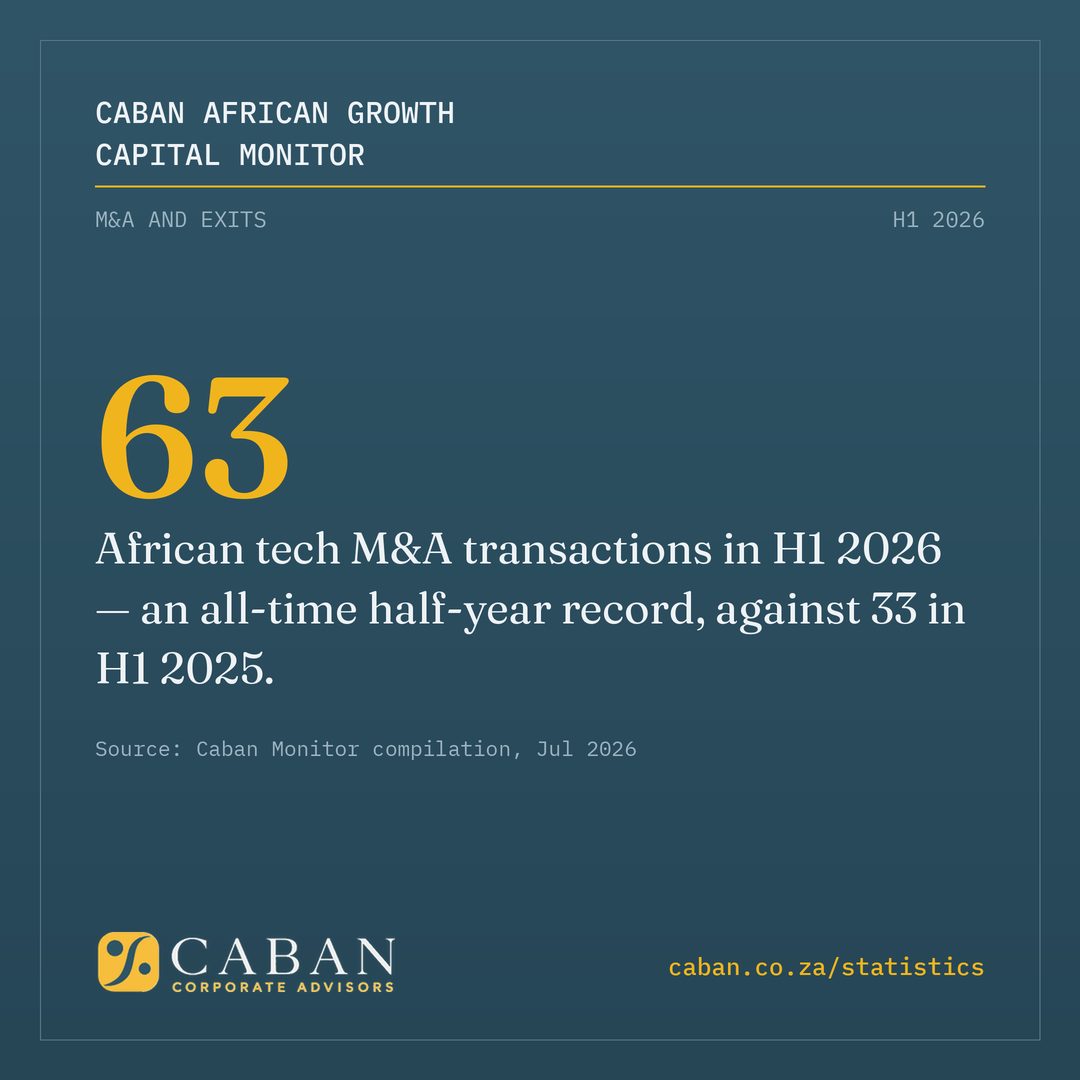
Announced African start-up exits in H1 2026 — on pace to beat 2025’s full-year 48. Incl. DocFox→nCino, $75m.
Source: Announcements · Caban Monitor, Jul 2026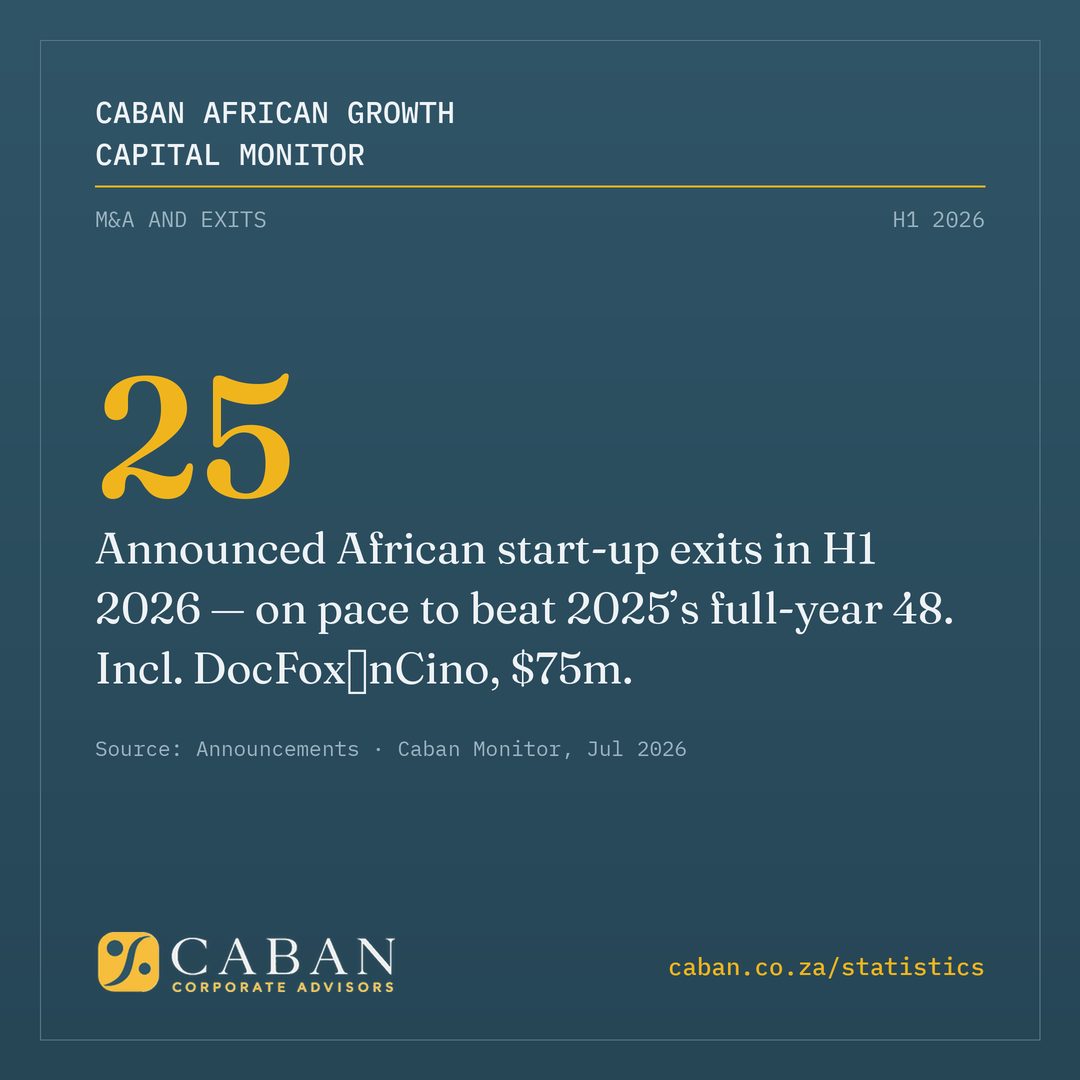
South African capital markets
Value of 384 successful M&A deals by SA listed companies in 2025 — up 5.35% on 2024.
Source: DealMakers South Africa, 2026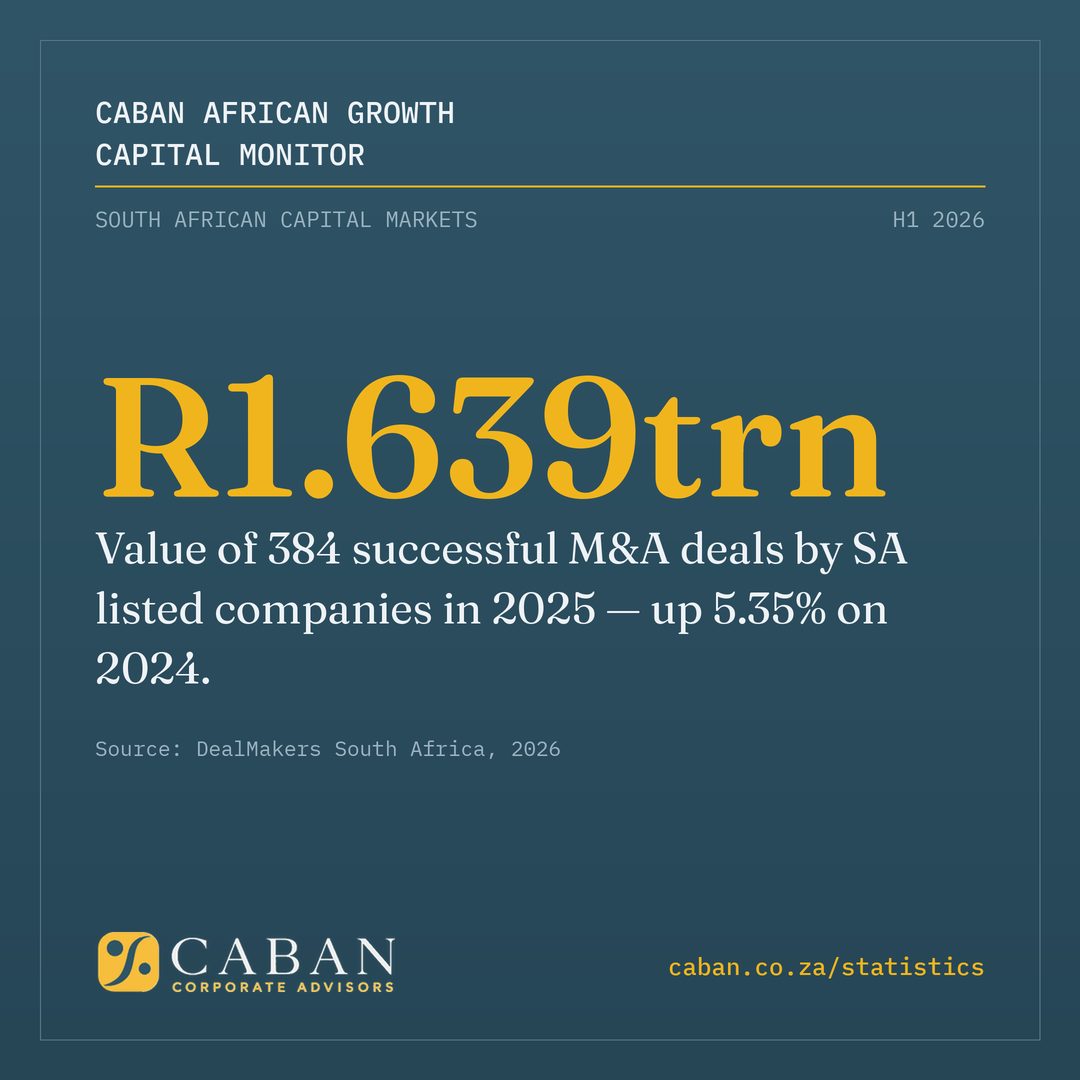
JSE delistings versus new listings in 2025 — value migrating from public to private hands.
Source: Exchange data, 2026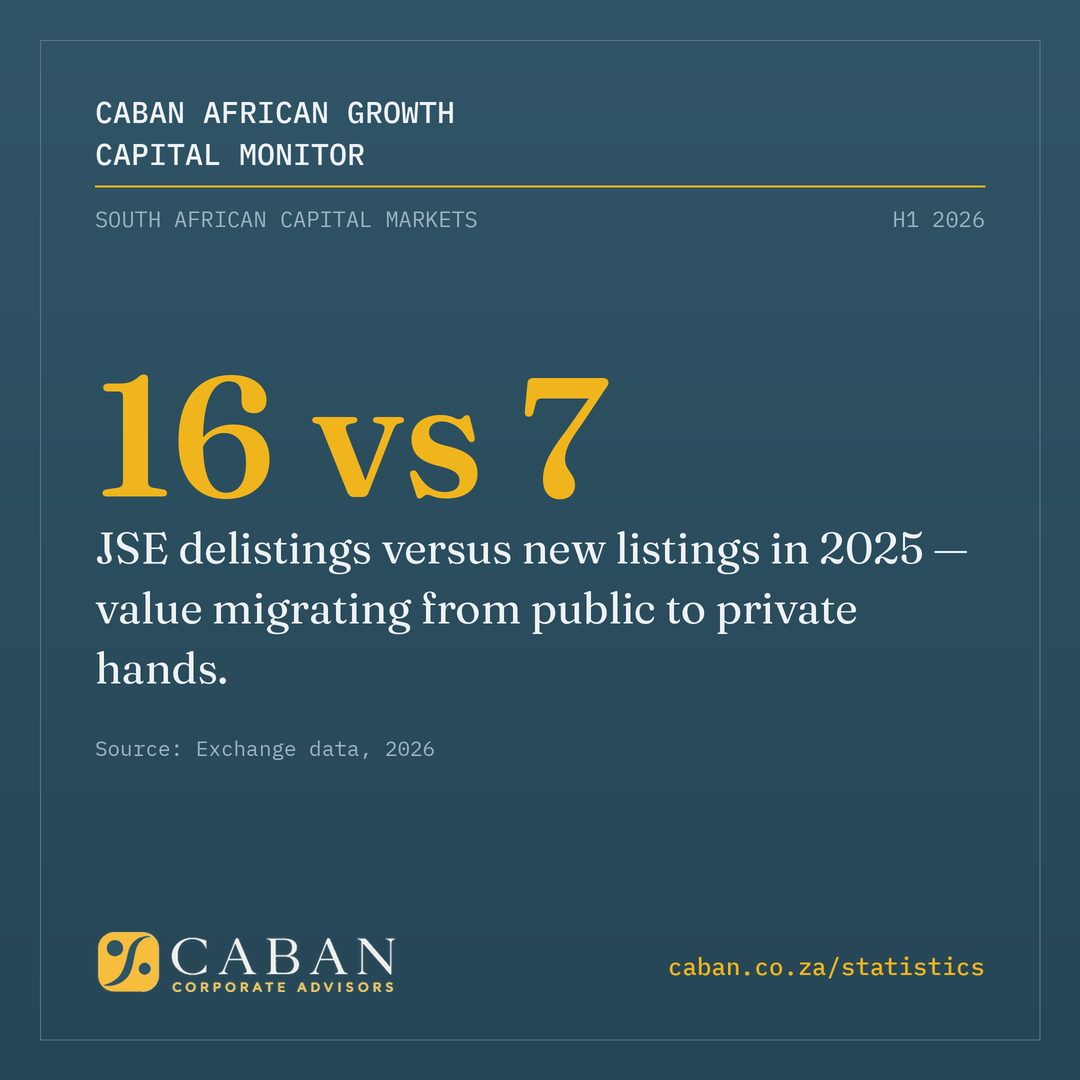
Cross-border deals by SA listed companies in Q1 2026 with European counterparties — the largest bloc.
Source: DealMakers South Africa, Q1 2026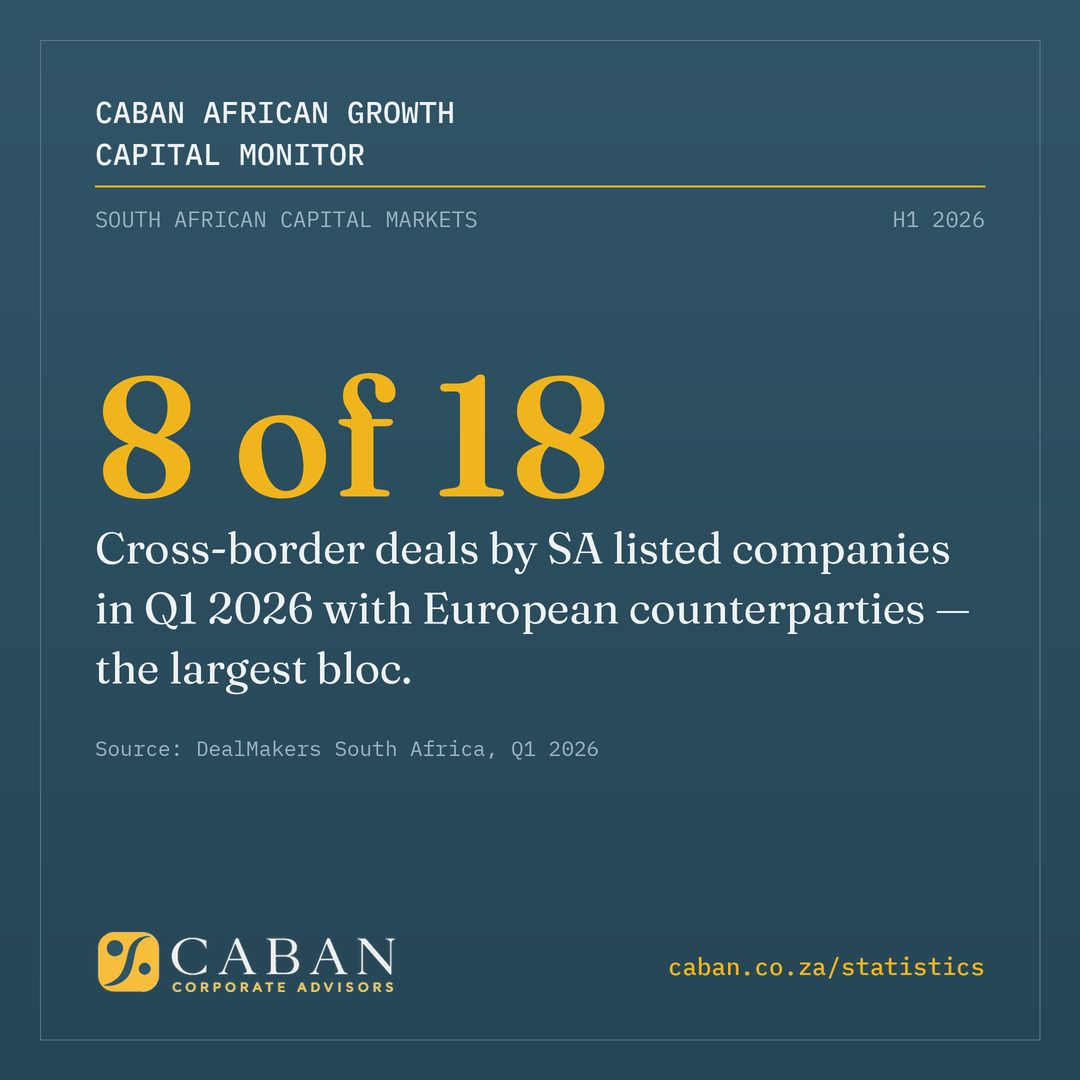
Using these numbers to plan a raise?
The data says South African capital is scarce and slow. Preparation is the variable you control. Caban structures raises, sales and blended funding — 200+ transactions since 2012, every enquiry reviewed by a principal.
Five-minute readiness checkTalk to a principalHow to cite these statistics
Free to cite with attribution. Suggested format: “Caban African Growth Capital Monitor, [statistic], caban.co.za/african-startup-funding-statistics” — or cite the underlying tracker named against each figure. For interview comment or the methodology behind any number, contact the research desk via caban.co.za/contact.
Methodology: figures compiled quarterly from Africa: The Big Deal (deals of $100k+, excluding exits), Launch Base Africa, TechCabal Insights, Condia, and published South African deal-market reporting. Where trackers conflict we show the range rather than select a number. Figures are as reported at the time of each quarterly update and may be restated by trackers as deals are disclosed. This page updates with each Monitor edition; the URL is permanent.