
Local-Currency Capital in African Private Markets: The FX Problem Nobody Prices
Analytical work in progress — circulated to practitioners and researchers for comment before formal publication.
A dollar-denominated equity investment in an African business carries a currency exposure that sits, unpriced, on the shareholder. This working paper measures it. Using annual average exchange rates for the rand, naira, cedi and Kenyan shilling from 2010 to 2023, it asks how much dollar value an asset of constant local-currency value lost over rolling five-year holds. The median loss was 14% for the shilling, 27% for the rand, 46% for the naira and 57% for the cedi; the worst windows ran from 28% to 62%. To earn a 20% dollar return over five years at the median window’s depreciation, a business would have had to grow its local-currency value by roughly 24% a year in Kenya, 28% in South Africa, 36% in Nigeria and 42% in Ghana. The paper then reviews the instruments that exist to move this risk, from bank forwards to multilateral-backed local-currency hedging, and sets out why few investments appear to use them. It closes with what this means for how African businesses should present, and how investors should price, a raise.
1. The cost nobody puts in the model
An investor who buys shares in an African company with US dollars is making two bets. The first is on the business: its customers, margins and growth. The second is on the currency in which that business earns. The first bet is analysed in detail, in diligence reports, models and investment committee papers. The second is usually reduced to a sensitivity table or a single assumption.
That asymmetry matters because the two bets are of similar size. A business that grows its local-currency value by 20% a year, in a currency that loses 15% a year against the dollar, delivers the dollar investor roughly 2% a year. The founder sees a business that doubled in four years. The shareholder sees almost nothing.
This paper puts numbers on the second bet for four currencies, using public data only. It does not forecast exchange rates, and it makes no claim that the drag will repeat. Its purpose is narrower: to show how large the historical cost was, and what it implies for the return a local business has to generate before a dollar investor is better off.
2. Data and method
We use annual average exchange rates, expressed as local currency per US dollar, for South Africa, Nigeria, Kenya and Ghana from 2010 to 2023, taken from the Penn World Table version 11.0 as published by the Federal Reserve Bank of St. Louis.1 For the rand we cross-checked the series against the OECD’s average-of-daily-rates series; the two agree to within about 0.3% in every year.2 The window ends in 2023 because that is the last year available in the common series for all four currencies.
For each currency we treat an asset worth a constant amount in local currency and ask what share of its dollar value was lost between year t and year t+5. We call each such pair a window; 2010 to 2023 gives nine overlapping five-year windows per currency. Five years is the hold period most often assumed for growth-equity investments, and the overlap means the nine windows are not independent observations. We report the best, median and worst of the nine.
3. What the data shows
Over the full 2010 to 2023 period, all four currencies lost substantial dollar value. The table below shows the starting and ending annual averages, the compound annual drift in the local-currency price of a dollar, and the share of dollar value lost by a constant local-currency asset.
| Currency | 2010 (per US$) | 2023 (per US$) | Annual drift | Dollar value lost, 2010–23 |
|---|---|---|---|---|
| Kenyan shilling | 79.2 | 139.8 | 4.5% | 43% |
| South African rand | 7.32 | 18.45 | 7.4% | 60% |
| Nigerian naira | 150.3 | 625.2 | 11.6% | 76% |
| Ghanaian cedi | 1.43 | 11.02 | 17.0% | 87% |
Annual drift is the compound annual rise in the local-currency price of one US dollar. Source: Penn World Table 11.0 via FRED; Caban research desk calculations.
The ordering is not surprising, but the magnitudes are worth stating plainly. Even the shilling, the most stable of the four, lost 43% of its dollar value over thirteen years. The cedi lost 87%.
A thirteen-year average hides what a single investment experiences, so the more relevant view is the five-year window.
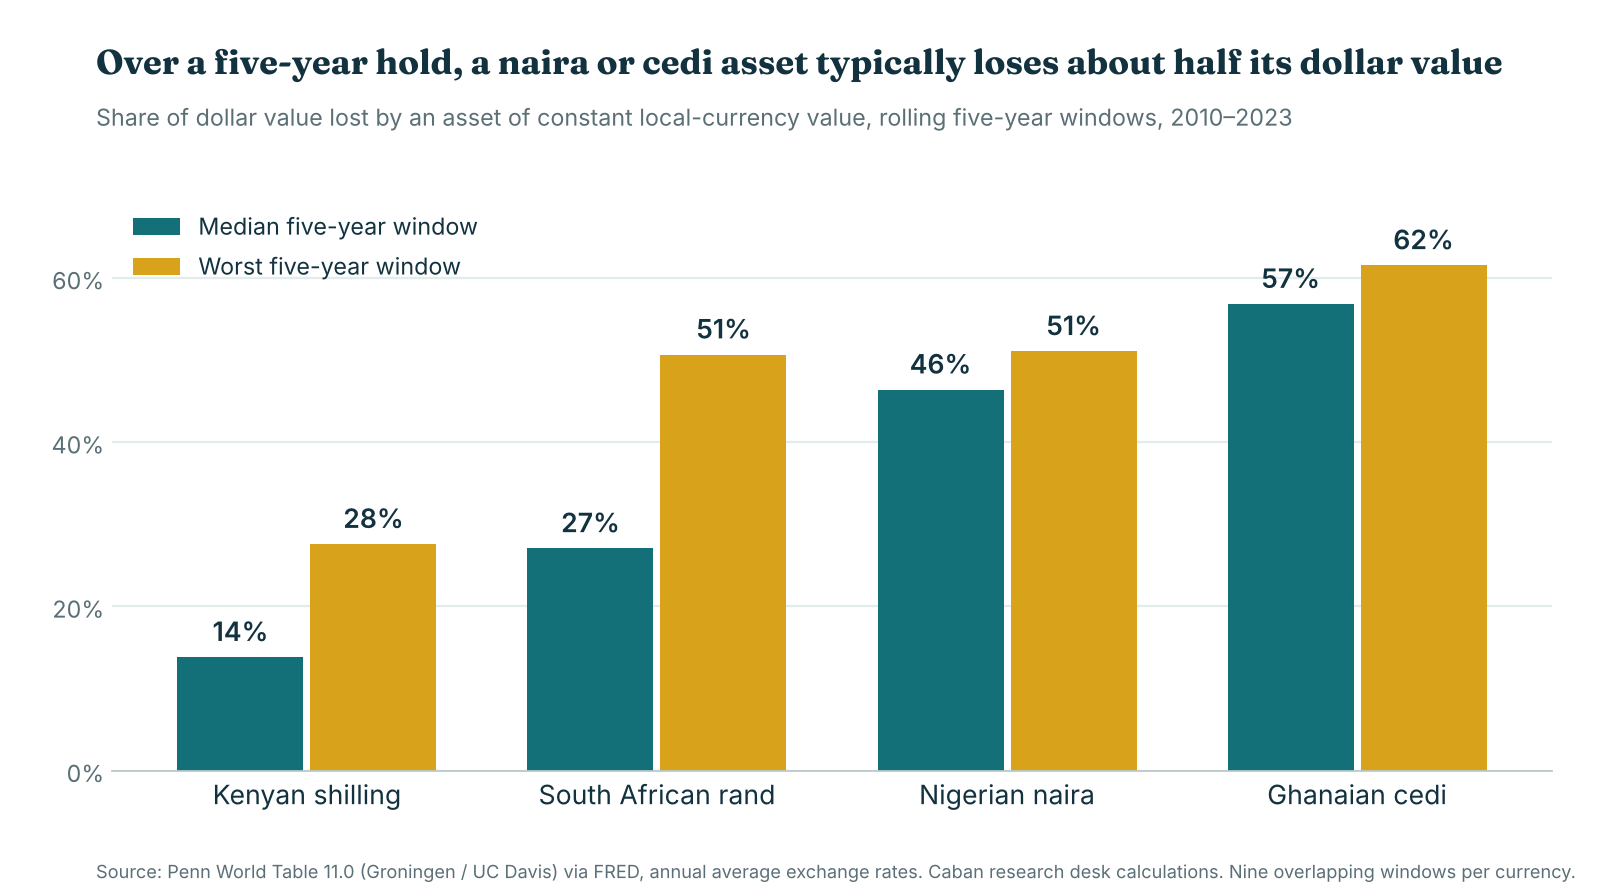
| Currency | Best window | Median window | Worst window |
|---|---|---|---|
| Kenyan shilling | 7% (2016–21) | 14% | 28% (2018–23) |
| South African rand | about 0% (2016–21) | 27% | 51% (2011–16) |
| Nigerian naira | 22% (2010–15) | 46% | 51% (2018–23) |
| Ghanaian cedi | 33% (2016–21) | 57% | 62% (2010–15) |
Share of dollar value lost over a five-year window for an asset of constant local-currency value. Nine overlapping windows per currency.
Three features stand out. First, in all nine windows for every currency the dollar investor ended with less value than the local-currency asset would suggest; there is no five-year window in this sample in which a hold in any of the four currencies was free of drag, though the rand came close between 2016 and 2021. Second, the range within a currency is wide. The rand lost almost nothing over 2016 to 2021 and half its dollar value over 2011 to 2016, so the entry year decides the outcome as much as the business does. Third, the naira’s drag in this data is concentrated in the second half of the window; the series shows a sharp step in 2023, and the loss over 2018 to 2023 is the worst window in the sample.
The Nigerian figures also need a caution. The Penn World Table series blends official and estimated market rates, and the official rate and the rate at which dollars were actually available diverged for much of this period. Published World Bank-based figures put the 2024 annual average near ₦1,479 per dollar,3 more than double the 2023 average in this data. That move falls outside our window, so the naira results above understate, rather than overstate, the most recent experience.
4. What it does to the return a business must earn
The drag can be restated as a hurdle. If a dollar investor wants a 20% annual dollar return, and the currency depreciates by d a year, the business has to grow its local-currency value by (1.20 × (1 + d)) − 1 a year. Applying each currency’s median five-year depreciation from the data gives the following.
| Currency | Median annual depreciation (five-year windows) | Local-currency return needed for a 20% dollar return |
|---|---|---|
| Kenyan shilling | 3.0% | 23.6% |
| South African rand | 6.5% | 27.8% |
| Nigerian naira | 13.3% | 35.9% |
| Ghanaian cedi | 18.3% | 41.9% |
Illustrative arithmetic, not a forecast. Uses the median annualised depreciation across the nine five-year windows and a 20% target dollar return.
The point is not that these returns are unachievable. Nominal growth in local currency is partly inflation, and currencies with higher inflation tend to depreciate more, so some of the drag is offset by higher nominal revenue. But that offset is already inside the business’s numbers when it is valued in local currency, and it is the dollar investor who then converts the result at the end. The hurdle in the table is the practical expression of why a business that looks healthy in its own accounts can look mediocre in the investor’s.
5. Instruments that exist
The exposure can be moved in several ways. None removes the cost; each makes it visible, transfers it, or changes who bears it.
- Bank forwards and swaps. A forward contract fixes a future exchange rate. In currencies with a relatively deep market, the rand being the clearest case, forwards are more readily available. In thinly traded currencies, available tenors are generally shorter than a typical equity hold, which leaves the longer part of the exposure open. A forward does not remove the cost of depreciation: its price reflects the interest-rate gap between the two currencies, so what it does is convert an uncertain loss into a known cost.
- Multilateral-backed local-currency hedging. The Currency Exchange Fund (TCX), backed by 19 multilateral and bilateral development finance institutions and several governments, exists to provide local-currency financing terms for international lenders in emerging and frontier markets. It states that it has hedged more than US$21 billion in total volume.4 TCX describes its role as helping international lenders, so its direct relevance to an equity investor in a single business is limited.
- Local-currency lending and funds. Development finance institutions and some funds lend or invest in local currency, taking the exchange-rate risk onto their own balance sheets. For a business that earns locally, this aligns the currency of funding and revenue, but the capital is limited in volume.
- Structuring around the exposure. Where hedging is unavailable or unaffordable, the exposure can be dealt with in the terms: dollar-linked revenue (for businesses that export or price in dollars), return thresholds expressed in local currency with a dollar floor, or an agreed currency-adjustment mechanism in the valuation. These are negotiated, not standard, and they appear in the term sheet rather than in the hedging market.
6. Why so little capital appears to use them
We have not measured how much African private capital is hedged, and no public dataset we know of does. What follows is therefore a set of hypotheses consistent with the structure of the market, not findings.
- Cost is visible; drag is not. A hedge has a price that shows up in the cash flows. Depreciation shows up later, in the exit proceeds, and is often attributed to the market rather than to a choice not to hedge.
- Tenor mismatch. Where instruments exist, they tend to be shorter than a five- to seven-year equity hold, so a hedge has to be rolled, with the cost reset each time.
- The investor and the business are not the same party. The company earns in local currency, the fund reports in dollars, and neither side has a clear mandate to carry the hedging cost.
- Scale. Hedging mechanisms appear to be built mainly for lenders and large funds. A small equity cheque into a single growth business may be too small to justify a dedicated hedging arrangement.
7. What this means for a raise
- Show the numbers in both currencies. A business that presents its growth, valuation and projected returns in local currency and in dollars, with the exchange-rate assumption stated, answers the investor’s second bet before it is asked.
- Identify natural hedges. Dollar-linked revenue, dollar-priced inputs that offset costs, or assets that hold their value in hard currency all reduce the drag that falls on the shareholder. They are worth stating as such.
- Match the currency of capital to the currency of earnings. Where the business earns only locally, local-currency debt, local institutional capital or a local-currency tranche removes the mismatch rather than pricing it.
- Expect the valuation conversation to include currency. Where the dollar investor prices the drag, it appears as a lower valuation or a higher required return; a founder who has done the arithmetic can anticipate it rather than be surprised.
8. Limitations
This is a working paper and its limits should be stated. Annual averages smooth intra-year moves, so the worst peak-to-trough loss within a window was larger than the figures here. The sample is four currencies over thirteen years, with nine overlapping windows each, which describes history and does not predict the future. The exchange-rate series blends official and estimated market rates, particularly for Nigeria. The arithmetic ignores the interest-rate differential, dividends, taxes and transaction costs. The hurdle-rate calculation is illustrative. Finally, the evidence on hedge usage in section 6 is reasoning from market structure, not measured behaviour; a fuller study would need transaction-level data that we do not have.
We circulate this paper to practitioners and researchers for comment, and would welcome correction, challenge and additional data, in particular on the actual use of hedging instruments in African private equity and venture transactions.
References
- Feenstra, R. C., Inklaar, R. and Timmer, M. P., Penn World Table 11.0, University of Groningen and University of California, Davis; annual exchange rates (market+estimated), national currency units per US dollar, as published by the Federal Reserve Bank of St. Louis (FRED), series for South Africa, Nigeria, Kenya and Ghana, accessed November 2026.
- OECD, Currency Conversions: US Dollar Exchange Rate, Average of Daily Rates, National Currency, South Africa (annual), via FRED, accessed November 2026.
- World Bank, World Development Indicators, official exchange rate (local currency units per US dollar, period average), Nigeria 2024, as republished in secondary reporting; indicative only.
- The Currency Exchange Fund (TCX), organisation website, accessed November 2026 (shareholders and cumulative hedged volume).